
Is What CUDA Graph Saves Really Launch Time?
Jinyang Su · September 23, 2026
Kern: github.com/pegainfer-project/kern
The gain from CUDA Graph does not mainly come from “saving kernel launch time.”
- Agent workloads are dominated by short prefill: AgentX’s cache hit rate is 98.3%, the median number of tokens that actually need prefill per request is 1.6k, and 85% of requests are no more than 4k.
- When the host is fast enough, graph only saves the handoff overhead on the GPU side: one Kern decode step issues 839 kernels, the host needs only 2.5 ms, the GPU needs 9.9 ms. Turning graph on is 283 µs faster, and that comes from each kernel’s handoff on the GPU being 0.3–1 µs faster.
- Python engines are slow in the glue code between kernels, not in launch itself: sglang’s interval between two adjacent launches is about 74 µs, Kern’s is about 3.4 µs. Below 3k tokens sglang is blocked by the host and the GPU is only 19–63% busy, which has to be made up by piecewise graph; after stitching it into a complete service there is also the GIL problem.
- Measured short prefill (Qwen3.8-27B, GB300, conc1, TTFT p50 of cold prefill), Kern/vLLM/sglang
AgentX Workload Analysis
Section titled “AgentX Workload Analysis”Before we start discussing CUDA Graph gains, I want to introduce the prefill workload of the agent era to you once again.
Thanks to semianalysis for open-sourcing this dataset; we do some simple analysis based on it.
https://inferencex.semianalysis.com/agentx/cc-traces-weka-062126
Simply put, in the agent era, because the hit ratio is extremely high, the number of tokens that actually need prefill computation is not large; it is very likely just prefill for things like tool call results.
Also, this trace uses 64-token hash ids, and incomplete blocks may bring some reduction in “hit ratio”, but the impact should be very small.
So how to finish short prefill quickly may be a key factor for inference engines under agent workloads.
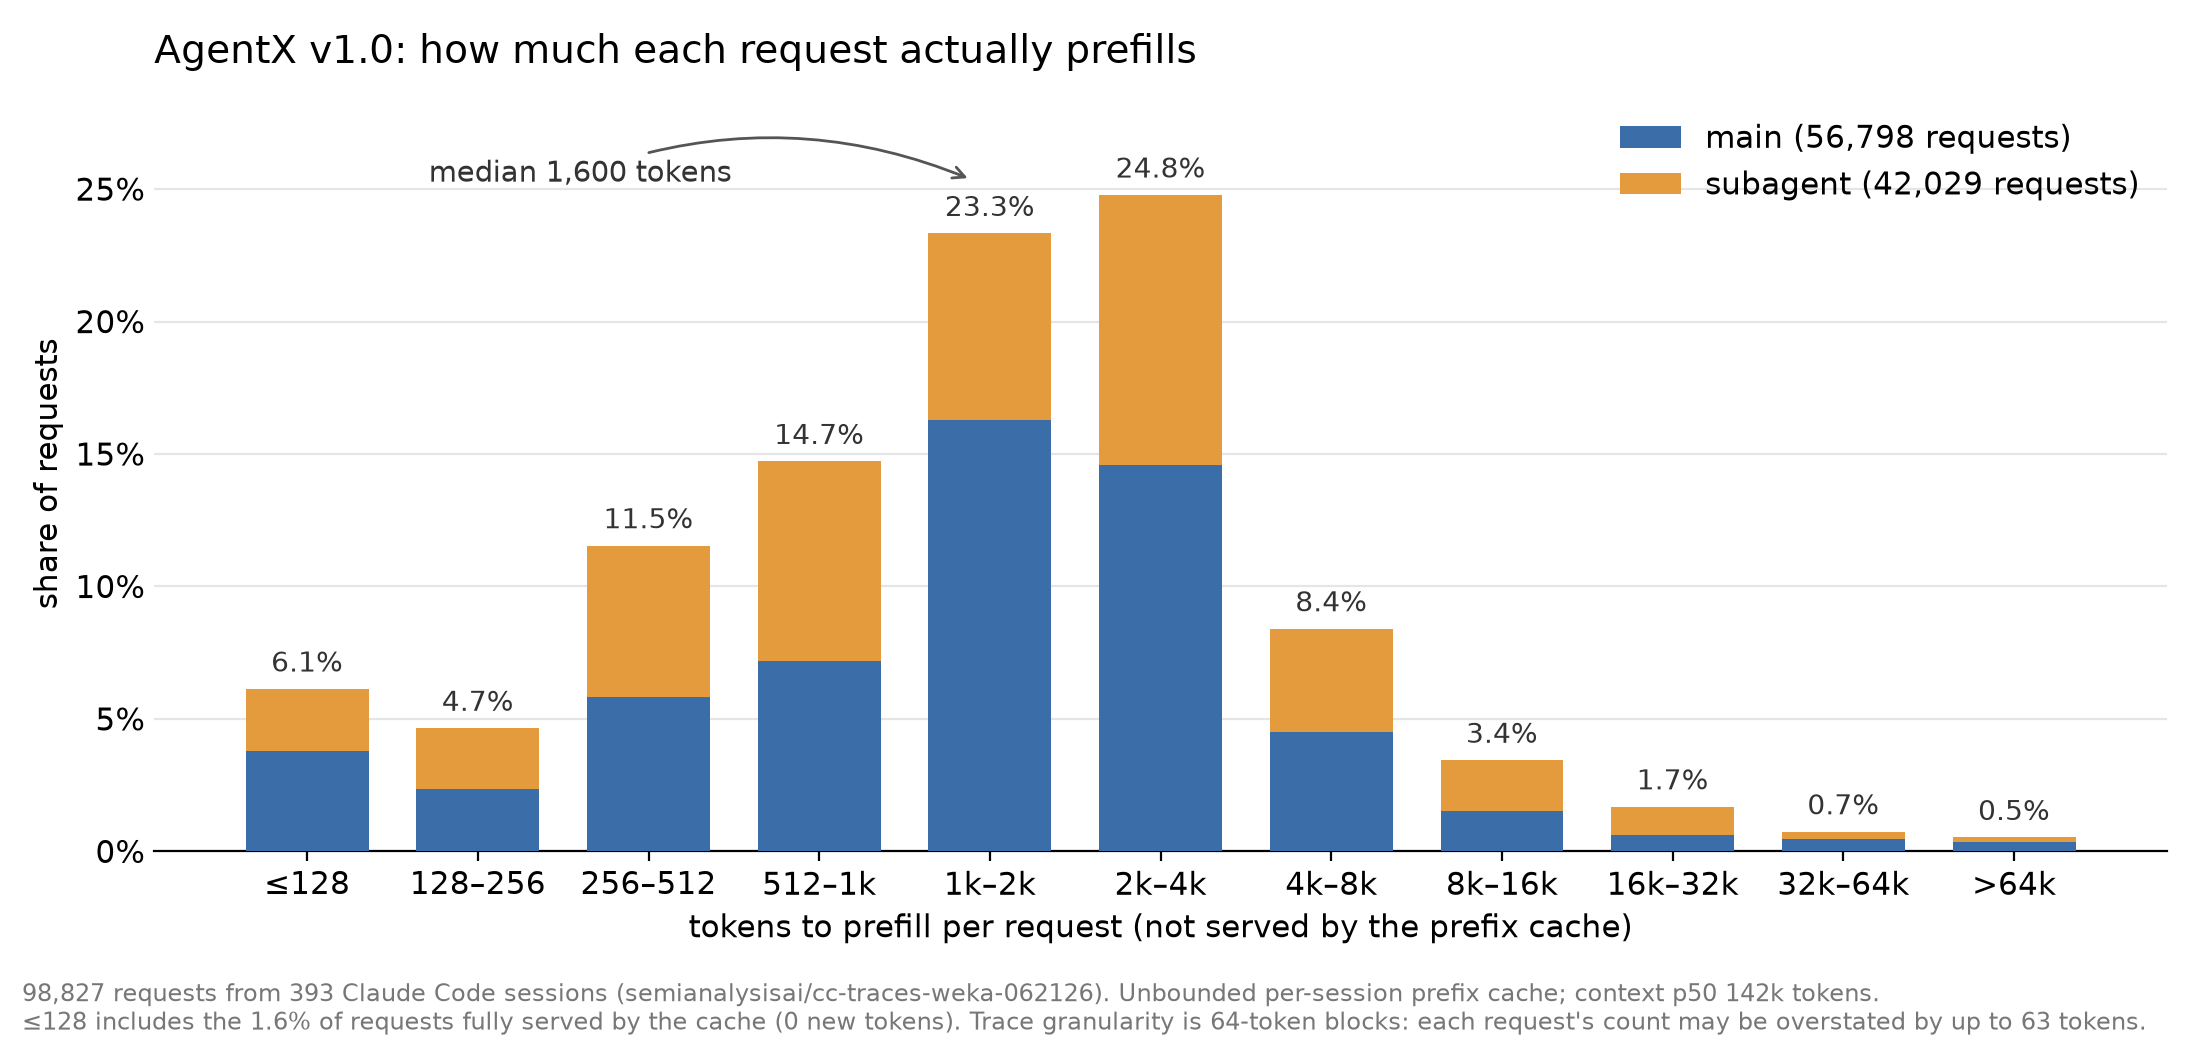
50% of requests only need to prefill about 1.6k tokens, and 85.2% of prefill requests are ≤4k. In the agent era, we need to pay more attention to the speed of handling short prefill requests, not just to long prefill (of course they are also very important).
This workload also brings some thoughts at the scheduling level; stay tuned for our scheduling blog.
Analyzing CUDA Graph’s Impact on Performance
Section titled “Analyzing CUDA Graph’s Impact on Performance”When we discuss CUDA Graph, a benefit we often cite is, oh, it reduces the kernel launch overhead, and as you know kernel launch takes quite a lot of time. So at the inference engine level we spend a huge amount of effort maintaining CUDA Graph, and it does look like turning graph on and off really does improve performance.
But do the gains brought by turning graph on really come from the time consumed by “CUDA Graph reduces kernel launch”?
When I was writing two Rust inference engines (pegainfer, Kern), I found that sometimes not turning Graph on has no impact on performance at all, while for engines written in Python, turning Graph on brings a bigger performance gain.
We discuss two workloads. First the decode workload, https://huggingface.co/pegainfer/kern-qwen38-sm103; for example, for the heavily fused Qwen3.8-27B in Kern, ignoring the draft model for now, one target model decode forward needs 839 launches in total.
The reason there are so few kernels is that Kern + agent are heavily fused, but that is not the focus of this article.
The host and GPU are a producer-consumer pair: the host issues kernels and the GPU executes kernels, so there are two cases:
- The host issues slower than the GPU processes: there is a GPU bubble caused by waiting for the host to issue the next kernel,
- The host issues faster than the GPU processes: kernels queue up in the queue, and even so there is still a tiny bubble between kernel and kernel.
So how fast can the host issue? We write a simple test:
// Host cost of one kernel launch from C++.// nvcc -O2 -o launch_min launch_min.cu -lcuda && ./launch_min#include <cuda.h>#include <cuda_runtime.h>#include <algorithm>#include <chrono>#include <cstdio>#include <vector>
__global__ void empty() {}
constexpr int N = 512;
template <class F> double us_per_launch(F issue, cudaStream_t s) {    std::vector<double> v;    for (int r = 0; r < 200; r++) {        auto t = std::chrono::steady_clock::now();        issue();        double us = std::chrono::duration<double, std::micro>(std::chrono::steady_clock::now() - t).count();        cudaStreamSynchronize(s);        if (r >= 20) v.push_back(us / N);    }    std::sort(v.begin(), v.end());    return v[v.size() / 2];}
int main() {    cudaStream_t s;    cudaStreamCreateWithFlags(&s, cudaStreamNonBlocking);    cudaFunction_t f;    cudaGetFuncBySymbol(&f, (const void*)empty);
    auto runtime = [&] { for (int i = 0; i < N; i++) empty<<<1, 32, 0, s>>>(); };    auto driver = [&] {        for (int i = 0; i < N; i++) cuLaunchKernel((CUfunction)f, 1, 1, 1, 32, 1, 1, 0, s, nullptr, nullptr);    };
    cudaGraph_t g;    cudaGraphExec_t ge;    cudaStreamBeginCapture(s, cudaStreamCaptureModeGlobal);    runtime();    cudaStreamEndCapture(s, &g);    cudaGraphInstantiate(&ge, g, 0);    auto graph = [&] { cudaGraphLaunch(ge, s); };
    printf("driver  cuLaunchKernel  %.3f us/launch\n", us_per_launch(driver, s));    printf("runtime <<<>>>          %.3f us/launch\n", us_per_launch(runtime, s));    printf("graph   %d kernels      %.3f us/launch\n", N, us_per_launch(graph, s));    return cudaGetLastError();}
The results on GB300 are as follows (CUDA 13.1):
driver cuLaunchKernel 1.252 us/launchruntime <<<>>> 1.336 us/launchgraph 512 kernels 0.003 us/launchResults on my own consumer card, a 5070 Ti (4 runs):
driver cuLaunchKernel 2.70-2.83 us/launchruntime <<<>>> 2.90-3.04 us/launchgraph 512 kernels 0.006 us/launchOf course this is the lower bound of kernel launch, a function that could not be any simpler.
Back to the earlier point: how long does it take for the host to issue 839 kernels? 2.5 ms, about 3 µs each.
Among them cuBLAS has the biggest launch overhead. cuBLAS, as everyone’s default GEMM choice, has SOTA performance, and behind that there actually is a trade-off.
// Host cost of one bs=1 cuBLAS GEMM vs one empty kernel.// nvcc -O2 -arch=native -o cublas_min cublas_min.cu -lcublas && ./cublas_min [n k]#include <cublas_v2.h>#include <cuda_runtime.h>#include <algorithm>#include <chrono>#include <cstdio>#include <cstdlib>#include <vector>
__global__ void empty() {}
template <class F> double us_per_call(F f, cudaStream_t s) {    std::vector<double> v;    for (int r = 0; r < 200; r++) {        auto t = std::chrono::steady_clock::now();        for (int i = 0; i < 256; i++) f();        v.push_back(std::chrono::duration<double, std::micro>(std::chrono::steady_clock::now() - t).count() / 256);        cudaStreamSynchronize(s);    }    std::sort(v.begin() + 20, v.end());    return v[110];}
int main(int argc, char** argv) {    int n = argc > 2 ? atoi(argv[1]) : 34816, k = argc > 2 ? atoi(argv[2]) : 5120;    cudaStream_t s;    cudaStreamCreateWithFlags(&s, cudaStreamNonBlocking);    void *x, *w, *y;    cudaMalloc(&x, k * 2); cudaMalloc(&w, (size_t)n * k * 2); cudaMalloc(&y, n * 2);    cublasHandle_t h;    cublasCreate(&h);    cublasSetStream(h, s);    float alpha = 1, beta = 0;
    // y[1,n] = x[1,k] @ w[n,k]^T    auto gemm = [&] {        cublasGemmEx(h, CUBLAS_OP_T, CUBLAS_OP_N, n, 1, k, &alpha, w, CUDA_R_16BF, k, x, CUDA_R_16BF, k,                     &beta, y, CUDA_R_16BF, n, CUBLAS_COMPUTE_32F, CUBLAS_GEMM_DEFAULT);    };    printf("empty kernel             %.2f us\n", us_per_call([&] { empty<<<1, 32, 0, s>>>(); }, s));    printf("cublasGemmEx n=%d k=%d  %.2f us\n", n, k, us_per_call(gemm, s));    return cudaGetLastError();}
We tested all the shapes used in the Qwen3.8 decode forward:
| GEMM | n | k | Calls per step | Host time | Kernels issued per call |
|---|---|---|---|---|---|
in_proj_ba | 96 | 5120 | 48 | 6.71 µs | 2 |
o_proj / out_proj | 5120 | 6144 | 16 + 48 | 6.41 µs | 2 |
down_proj | 5120 | 17408 | 64 | 6.32 µs | 2 |
qkv_proj | 14336 | 5120 | 16 | 6.33 µs | 2 |
in_proj_qkvz | 16384 | 5120 | 48 | 4.50 µs | 1 |
gate_up | 34816 | 5120 | 64 | 4.66 µs | 1 |
lm_head | 248320 | 5120 | 1 | 4.59 µs | 1 |
First, this part that is around 4 µs: why is it a few µs more than an empty kernel, and where does the extra time go?
- cuBLAS first picks a specific algorithm according to the shape, which takes about 1.1 µs; of course you can pin the algorithm to reduce launch overhead
- Querying some driver attributes: about 0.2 µs, for example whether this stream is one of green ctx, plus a just-in-case cuKernelGetAttribute check.
- CPU code inside cuBLAS: about 2 µs, not sure what it is doing.
- The launch itself: 1.5 µs
What is interesting is that in Qwen3.8 decode, cuBLAS has PDL enabled in its default launch parameters.
As for those 6 µs launches, it is because some rather skinny shapes (small bs, including some dimension of the high-parallelism split being very small) need split-k to achieve SOTA gemm; the cuBLAS implementation chooses to do it with two kernels, cuBLAS splits along the k dimension and then merges the result with a separate kernel, so it actually launches two kernels, which is one extra kernel launch of overhead compared with 4.5 µs.
So one decode forward is about 9.9 ms, with total launch time 2.5 ms. Of course, since filling up the queue also takes some time, there may be bubbles at the beginning, but this tiny issue bubble is basically only at the embedding kernel and the following few kernels, where there are a few µs of idle running; after that the host stays ahead the whole time.
So with a language like Rust/C++, the issue rate on GB300 is basically far beyond the GPU execution rate, which means that at least CUDA Graph’s gains do not come from this part.
The GPU Kernel ↔ Kernel Bubble
Section titled “The GPU Kernel ↔ Kernel Bubble”Even when the GPU kernels are already saturated, there is still a gap between the GPU executing one kernel after another, and this part has nothing to do with the host.
Still taking Qwen3.8 as an example (of course Kern uses a lot of PDL optimization, 818 out of the 839 are PDL, so this case is on the very optimistic side):
- eager takes 9.91 ms: of which the GPU is clearly idle for about 15 µs
- graph takes 9.62 ms: of which the GPU is clearly idle for only 4 µs
The actual e2e difference between the two is 283 µs, so besides the GPU bubble, what else does graph speed up?
We checked the actual duration of every kernel, “from the end of the previous kernel to the end of this kernel”: under eager, every kernel is about 0.3–0.5 µs slower than under graph, and operators without pdl are about 1 µs slower; over 839 of them, this adds up to exactly 280 µs.
For this part, because it is on the GPU, it is hard to really have evidence to prove it. We can only make some guesses: most likely graph itself completes some of the “launch” preprocessing overhead, and for this part there seems to be no other way besides turning graph on.
So overall, the gain in Kern Qwen3.8 decode is more about “finishing kernel execution faster” at the GPU level: 839 kernels buy about 300 µs. This means that if other implementations do not fuse well and do not turn on pdl much, and have, say, 4k kernels, at 0.8 µs per kernel, graph’s paper gain starts at 3.2 ms.
The second question naturally comes to the prefill workload, which today is the agent workload: the engine needs to handle many very short prefill requests of only a few hundred tokens, and they may only need tens of ms, which is also quite fast.
According to the earlier theory, at least in the case of Kern-optimized Qwen3.8, the gain from turning on graph for prefill should be very small, only coming from the few hundred µs saved at the GPU level.
Of course this is because GB300 is inferring a small model like Qwen3.8 27B, so the overall prefill is relatively fast.
| Prefill this round | graph | eager | Saved | Per call | Host issue |
|---|---|---|---|---|---|
| 128 token, empty cache | 13.93 ms | 14.60 ms | 4.6% | 0.59 µs | 3.20 ms |
| 256 | 16.16 | 16.86 | 4.2% | 0.62 | 3.18 |
| 384 | 20.26 | 20.91 | 3.1% | 0.58 | 3.23 |
| 512 | 23.08 | 23.73 | 2.7% | 0.58 | 3.17 |
| 768 | 33.31 | 33.90 | 1.7% | 0.52 | 4.17 |
| 1024 | 41.16 | 41.90 | 1.7% | 0.65 | 5.15 |
| 256, 4k already cached before | 16.78 | 17.48 | 4.0% | 0.62 | 3.17 |
| 256, 16k already cached before | 18.62 | 19.32 | 3.6% | 0.62 | 3.25 |
| 256, 32k already cached before | 21.07 | 21.78 | 3.2% | 0.63 | 3.39 |
How the Python Inference Ecosystem Launches a Kernel
Section titled “How the Python Inference Ecosystem Launches a Kernel”People often ask me: what performance benefits does writing an inference engine in Rust bring. Besides a host path that is more extremely stable (no GC, no torch), it does not even need async schedule to achieve “zero bubble” at the GPU level.
Let’s first talk about the Python + torch ecosystem, the normal path for launching a kernel. For example, you have written a CUDA kernel in C++, a simple add, so how does Python call it?
Take sglang as an example. These days sglang quite likes JIT, even for C++ kernels, but we ignore JIT and assume the kernel is already compiled; sglang goes through a tvm ffi call. In the end it may also register it into torch ops.
We can also reproduce the previous test through tvm ffi; I will not paste the kernel timing part.
N = 512
def us_per_launch(issue, sync):    v = []    for r in range(200):        t = time.perf_counter()        issue()        us = (time.perf_counter() - t) * 1e6        sync()        if r >= 20:            v.append(us / N)    return statistics.median(v)
def main():    cap = subprocess.check_output(["nvidia-smi", "--query-gpu=compute_cap", "--format=csv,noheader", "-i", "0"])    os.environ.setdefault("TVM_FFI_CUDA_ARCH_LIST", cap.decode().strip())    m = tvm_ffi.cpp.load_inline(        "launch_ffi", cuda_sources=SOURCE, functions=["make_stream", "sync", "launch", "launch_n", "make_graph", "replay", "last_error"]    )
    s = m.make_stream()    ge = m.make_graph(s, N)    launch = m.launch
    def python_loop():        for _ in range(N):            launch(s)
    sync = lambda: m.sync(s)    print(f"python -> tvm-ffi -> <<<>>>   {us_per_launch(python_loop, sync):.3f} us/launch")    print(f"C++ loop <<<>>>               {us_per_launch(lambda: m.launch_n(s, N), sync):.3f} us/launch")    print(f"graph   {N} kernels           {us_per_launch(lambda: m.replay(ge, s), sync):.3f} us/launch")    err = m.last_error()    if err:        print(f"CUDA error {err}, numbers above are invalid")
if __name__ == "__main__":    main()
Final timings:
python -> tvm-ffi -> <<<>>> 1.625 us/launch (second run 1.643)C++ loop <<<>>> 1.420 us/launch (second run 1.418)graph 512 kernels 0.004 us/launch (second run 0.003)It looks like only about 0.2 µs more, very efficient.
After adding torch’s tensor arguments, it only adds about 0.3 µs more.
But as far as we know, Python as a whole is still mainly torch-based now, and not many people write kernels like this.
Four integration paths:
| Style | Where in sglang | Call chain | host µs/call |
|---|---|---|---|
| tvm-ffi | lower bound | module.add(x, y, out) | 2.39–2.45 |
| JIT direct call | files like layernorm/norm.py, 76of them | Python wrapper → @cache_oncecache lookup → tvm-ffi | 2.65–2.72 |
| JIT wrapped as torch op | ops with @register_custom_op, 32files | torch.ops.sgl.add →dispatcher → Python impl → tvm-ffi | 7.87–8.01 |
| AOT | sgl_kernel (TORCH_LIBRARY) | torch.ops.sgl_aot.add →dispatcher → C++ | 4.16–4.27 |
Taking the worst 8 µs, the previous 839 kernels need 6.7 ms to issue, while the decode forward itself is only 9.91 ms; and if, as we estimated earlier, fusion is not aggressive and there are 4k kernels, launch alone may need 32 ms.
For decode, today’s py inference engines can basically all go into a graph, but for short prefill, only part of it can go into a graph, so short prefill may have a rather serious GPU bubble.
Another issue is that besides C++ jit, there are other jits now, such as CuTe DSL jit, triton jit and so on; if the cache is warm, the total time may be around 3 µs.
Hearing all this, py does not feel too bad? Right?
I have always felt that Python’s problem is not that a single script like this has poor performance in a benchmark, but that when different modules are stitched together into a service, the problem becomes the GIL.
For example, using sgl on a single card to serve one Qwen3.8, it starts these processes:
- http + tokenizer: 3 Python threads
- scheduler + worker process (one per card), this is the key one, 6 threads in total
- with hicache + l3 enabled, it adds 4 background Python threads for some asynchronous operations
- detokenizer process
- plus some processes used for compilation
We mainly care about the scheduler + worker process, because it is the process that actually issues kernels. Executing Python code requires holding the GIL, so what is the GIL’s scheduling policy?
For example, looking at 3.12’s py GIL policy, it is like this:
- No preemption support, it can only wait for the holder to release it itself
- A waiter needs to wait 5 ms first before asking for the lock
- Forced handover
- No priority
The specific semantics of the second one is what to do when a thread wants to take the GIL while the GIL is being held by someone else. For example, B wants to run py and finds that A holds the GIL, then B directly sleeps 5 ms; if A releases the GIL on its own within 5 ms, then B is woken up. If A keeps executing py code and does not release the GIL, then after 5 ms B will set gil_drop_request, reminding A to yield at the next checkpoint, to prevent B from starving. This is the scheduling algorithm introduced in 3.12.
This algorithm has a flaw: the more frequently a thread releases the lock, the more easily it gets cut in line. For example, for A above, as soon as it releases the lock and someone is waiting, it gets cut in. And kernel launch is exactly like this, releasing the lock frequently, and the alternation itself also has overhead.
At the same time, under EP,TP, one rank being “slow” drags down all the other ranks, because everyone is a state machine that needs to be fully synchronized, and this amplifies p99.
So vLLM and sglang have each researched their own system for this kind of short prefill; although the names are different, in essence it is piecewise graph:
- vLLM calls it piecewise CUDA Graph
- sglang calls it breakable CUDA Graph
Of course the two implementations are slightly different; if you ask my preference, I actually lean more toward sglang’s implementation, which does not depend on a compiler.
Short Prefill E2E Test
Section titled “Short Prefill E2E Test”We scanned the performance of Kern/vLLM/sglang, including vLLM and sglang with piecewise graph on and off, scanning 0-16k; the figure below is within 4k. Kern’s own prefill does not use any graph.
Among them we additionally measured sgl with hicache enabled (l3 file backend), including sgl with pure hicache (no l3). The TTFT on l3 rises a lot, possibly because the file backend is not well optimized, and it can be ignored, but it is also in a sense an effect of the Python GIL.
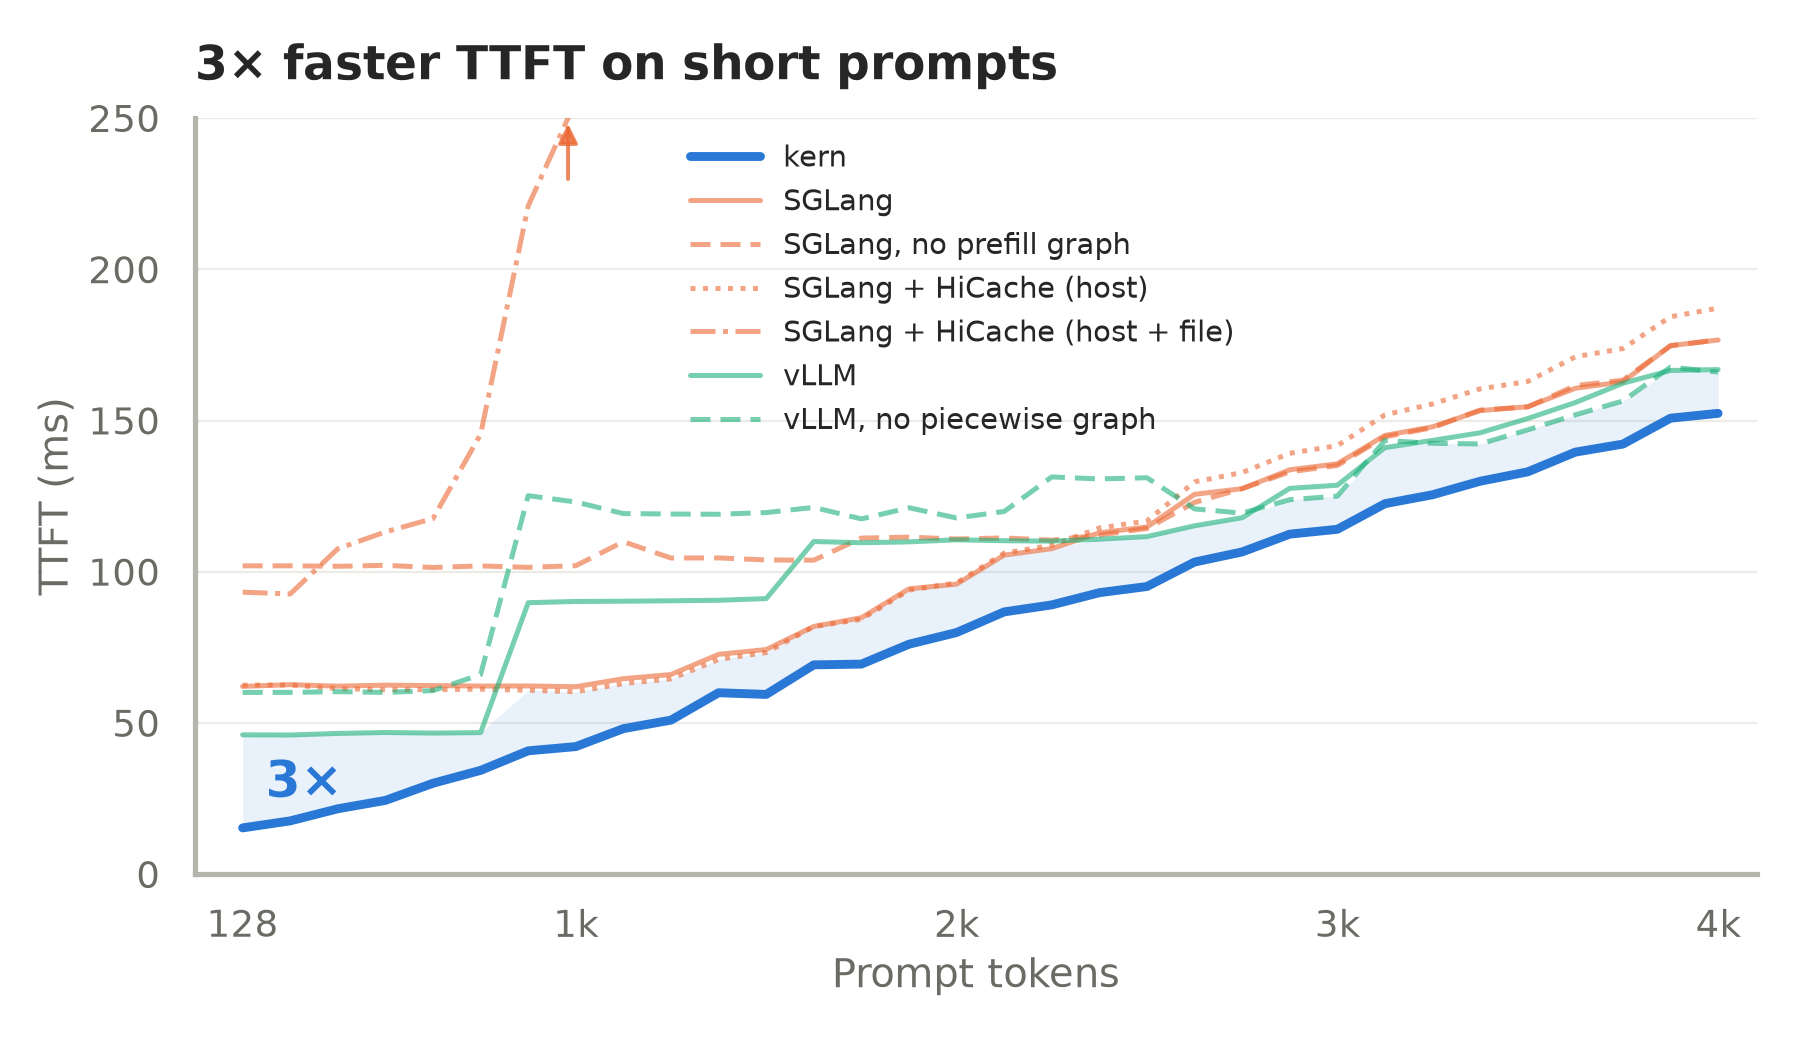
Below 4k, Kern maintains SOTA TTFT regardless of whether vLLM/sglang turn piecewise graph on or off, because graph can only cover part of it, and the rest that is not covered is still dominated by launch overhead.
TTFT ≈ fixed overhead of the request path + max(host time to issue one forward, GPU compute time)We observe the composition of sglang’s performance after turning off this kind of piecewise graph: after turning it off, sglang’s TTFT for short prefill requests rises, and the GPU idle rate rises at the same time.
| ISL | TTFT p50 (ms) | GPU busy (ms/request) | GPU busy share | Launches per request | Average launch interval (µs) |
|---|---|---|---|---|---|
| 128 | 142.0 | 26.7 | 19% | 1827 | 77.5 |
| 1024 | 141.8 | 53.6 | 38% | 1763 | 80.5 |
| 2048 | 143.5 | 90.1 | 63% | 1715 | 83.5 |
| 3072 | 144.4 | 130.4 | 91% | 1715 | 83.5 |
| 4096 | 180.1 | 172.4 | 96% | 1715 | 105.2 |
| 8192 | 365.9 | 358.2 | 98% | 1715 | 213.3 |
| 16384 | 822.5 | 816.4 | 99% | 1715 | 480.2 |
The launch overhead reaches 70 µs, which differs from our earlier conclusion from testing py launch kernel; the problem is that the model code is stitched together with py + torch, and behind every kernel there is some py host glue code, which slows down the overall launch rhythm. By comparison, Kern’s median kernel launch interval in a real prefill forward is 3.3 µs.
Appendix: Startup Commands, Benchmark Commands
Section titled “Appendix: Startup Commands, Benchmark Commands”Kern startup command:
kern-serve \ --manifest examples/qwen3.8-27b.json \ --kernels kernels-qwen38 \ --weights weights/Qwen3.8-27B \ --gpus 0 --port 8000sglang startup command:
docker run -d --name sgl-ttft-default --gpus '"device=1"' --ipc=host --network=host --shm-size 32g \ -v /mnt/shared:/mnt/shared --entrypoint bash \ lmsysorg/sglang:nightly-dev-cu13-20260922-582389ce -c \ "python3 -m sglang.launch_server \ --model-path Qwen3.8-27B \ --host 127.0.0.1 --port 30001 --tp 1"vLLM startup command:
docker run -d --name vllm-ttft-default --gpus '"device=1"' --ipc=host --network=host --shm-size 32g \ -v /mnt/shared:/mnt/shared --entrypoint bash vllm/vllm-openai:nightly -c \ "vllm serve Qwen3.8-27B \ --host 127.0.0.1 --port 30002 "Benchmark command:
TOK=Qwen3.8-27Becho "isl p50_ms p99_ms max_ms"for L in $(seq 128 128 4096) $(seq 5120 1024 16384); do vllm-bench \ --backend openai --host 127.0.0.1 --port 8000 --tokenizer $TOK \ --dataset-name random --random-input-len $L --random-range-ratio 1 --random-output-len 1 \ --prompt-token-ids --ignore-eos --extra-body '{"min_tokens":null}' \ --num-prompts 10 --num-warmups 1 --max-concurrency 1 --seed $L \ --percentile-metrics ttft --metric-percentiles 50,99,100TTFT p50 (ms), Kern / vLLM / sglang, cold prefill, 0–16k
| ISL | Kern | vLLM piecewise | vLLM no-pw | sglang BCG | sglang no-pgraph |
|---|---|---|---|---|---|
| 128 | 15.30 | 46.08 | 60.09 | 62.09 | 101.94 |
| 256 | 17.62 | 46.01 | 60.10 | 62.66 | 101.96 |
| 384 | 21.62 | 46.53 | 60.34 | 62.16 | 101.80 |
| 512 | 24.39 | 46.84 | 60.09 | 62.50 | 102.11 |
| 640 | 30.06 | 46.65 | 60.69 | 62.34 | 101.41 |
| 768 | 34.32 | 46.81 | 66.02 | 62.20 | 101.92 |
| 896 | 40.78 | 89.76 | 125.15 | 62.23 | 101.45 |
| 1024 | 42.18 | 90.17 | 123.06 | 61.97 | 102.00 |
| 1152 | 48.12 | 90.25 | 119.23 | 64.63 | 109.93 |
| 1280 | 50.94 | 90.39 | 119.08 | 66.01 | 104.53 |
| 1408 | 59.99 | 90.56 | 119.00 | 72.68 | 104.57 |
| 1536 | 59.43 | 91.11 | 119.56 | 74.27 | 103.90 |
| 1664 | 69.21 | 109.99 | 121.28 | 81.91 | 103.82 |
| 1792 | 69.45 | 109.59 | 117.47 | 84.79 | 111.12 |
| 1920 | 76.03 | 109.87 | 121.15 | 94.34 | 111.44 |
| 2048 | 79.90 | 110.56 | 117.78 | 95.91 | 110.83 |
| 2176 | 86.72 | 110.25 | 119.93 | 105.50 | 111.17 |
| 2304 | 89.04 | 110.12 | 131.35 | 107.63 | 110.44 |
| 2432 | 93.07 | 110.75 | 130.68 | 112.86 | 112.16 |
| 2560 | 95.11 | 111.62 | 131.08 | 114.80 | 114.31 |
| 2688 | 103.20 | 115.20 | 120.77 | 125.60 | 122.93 |
| 2816 | 106.55 | 117.85 | 119.39 | 127.47 | 127.47 |
| 2944 | 112.43 | 127.57 | 123.82 | 133.71 | 133.01 |
| 3072 | 114.03 | 128.60 | 125.00 | 135.70 | 135.14 |
| 3200 | 122.50 | 141.04 | 143.41 | 145.08 | 144.61 |
| 3328 | 125.46 | 143.43 | 142.47 | 147.92 | 147.64 |
| 3456 | 129.92 | 145.94 | 142.26 | 153.27 | 153.46 |
| 3584 | 133.03 | 150.66 | 146.91 | 154.56 | 154.50 |
| 3712 | 139.55 | 155.95 | 151.88 | 160.66 | 161.56 |
| 3840 | 142.21 | 162.32 | 156.46 | 162.79 | 163.34 |
| 3968 | 150.77 | 166.55 | 167.66 | 174.77 | 174.72 |
| 4096 | 152.37 | 166.84 | 166.02 | 176.62 | 176.67 |
| 5120 | 189.28 | 199.31 | 193.46 | 220.12 | 219.67 |
| 6144 | 228.95 | 239.97 | 236.68 | 265.90 | 266.66 |
| 7168 | 264.00 | 275.13 | 277.84 | 312.29 | 313.19 |
| 8192 | 306.35 | 308.00 | 308.27 | 362.03 | 363.76 |
| 9216 | 350.11 | 335.73 | 337.37 | 408.18 | 412.26 |
| 10240 | 390.23 | 388.76 | 390.38 | 459.97 | 464.34 |
| 11264 | 424.89 | 418.45 | 419.62 | 508.56 | 512.42 |
| 12288 | 465.31 | 462.58 | 458.17 | 572.33 | 576.26 |
| 13312 | 504.21 | 498.11 | 498.96 | 624.58 | 628.81 |
| 14336 | 545.31 | 542.32 | 549.19 | 689.97 | 695.14 |
| 15360 | 583.37 | 574.72 | 569.35 | 750.90 | 753.40 |
| 16384 | 626.26 | 608.43 | 601.72 | 820.51 | 824.59 |